

What Is a 10-K Summary?
A 10-K summary is a condensed, investor-focused synthesis of the most material information contained in a company’s annual report filed with the Securities and Exchange Commission (SEC). Filed annually, the 10-K offers a detailed picture of what a company does, the risks it faces, and its full financial report. This makes it one of the most authoritative documents available to investors. Because it is audited and comprehensive, the 10-K is considered the gold standard for financial analysis. Many 10-K documents reach over 150 pages. A well-constructed summary distills this often lengthy document into a structured, actionable reference that supports an investment thesis. Rather than simply re-reading the document, a good 10-K summary extracts the signal from the noise.
Specifically, these are the business model, competitive positioning, key financials, risks, and management commentary. The 10-K is the essential, audited source for valuation, and superior to the glossy annual report. This is because it is a legal document certified by executives, making it far more reliable than investor presentations or press releases. Summarizing a 10-K forces the analyst to engage deeply with the material and translate it into a format useful for making a buy, hold, or sell decision. The challenge is 10-K reports are very long. For example, the Tesla 10-K filing for FY 2025 is 102 pages plus Exhibits. Therefore, a summary can help reduce the time to understand the most critical aspects of a company before investing.
Sequence of How to Read the 10-K Sections from a Value Investor Standpoint
A value investor does not read a 10-K from cover to cover — they read it strategically, prioritizing sections that reveal intrinsic worth and margin of safety. In practice, 30 to 40 pages carry the information that matters most for investment research. The recommended sequence begins with Item 1 (Business), which requires a description of the company’s business, including its main products and services, subsidiaries it owns, and markets it operates in — this establishes the foundation for understanding what you are valuing. Next, move to Item 7, the Management’s Discussion and Analysis (MD&A). The MD&A provides a summary of the company’s performance over the past year, insights into how management views the company’s strengths and challenges, and future plans and strategies. This makes it invaluable for assessing the competence and transparency of the management team.
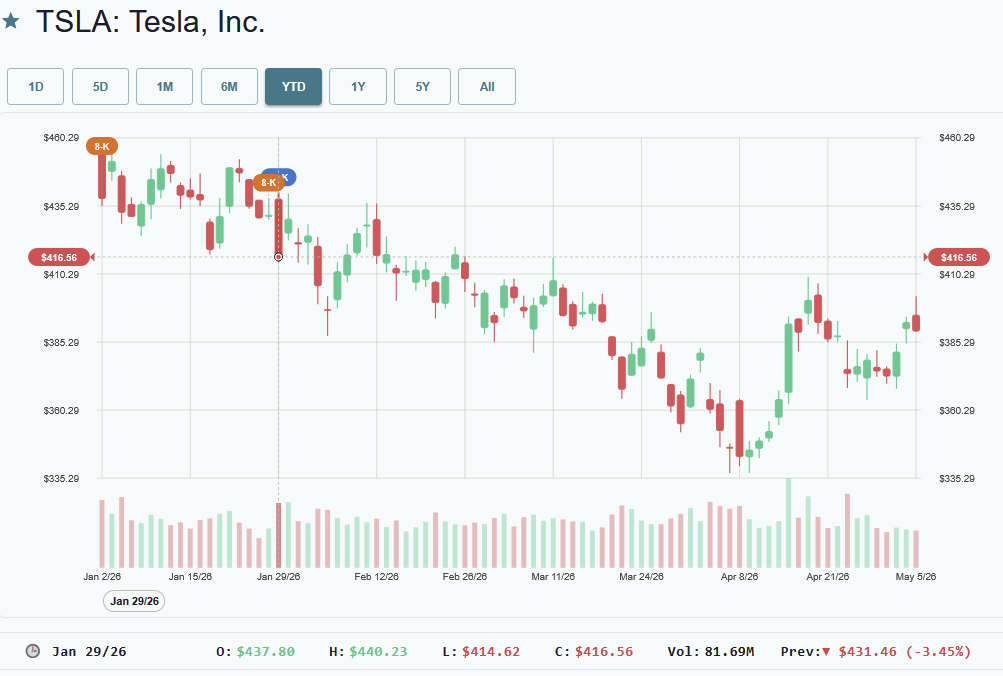
After the MD&A, review Item 8 (Financial Statements), then circle back to Item 1A (Risk Factors). Experienced investors “diff” the filings the way programmers diff code, paying attention to what changes between this year’s 10-K and last year’s. This is because new risk factors, altered language in the MD&A, or shifts in accounting policies often signal something important before it hits the news. Investors also want to understand key price changes that have occurred in the past during certain disclosures. Search10K provides a clickable pin at each point where a 10-K, 10-Q, 8-K or related document is published. For example, it displays the date Tesla’s 2025 10-K report was published, the stock went down by 3.5% compared to previous day’s close. The market reacted negatively to EV sales being below targets.
Compare the Current 10-K to a Past 10-K Report
The comparative financial analysis is the quantitative backbone of any 10-K summary. The 10-K typically presents at least two years of comparative financial data, sometimes three. Therefore, you don’t need to pull up old reports because the comparisons are already built in. That said, value investors benefit greatly from pulling the prior year’s full 10-K. This helps to cross-reference management’s earlier forward-looking statements against actual outcomes. You must compare the year-over-year growth rate of revenue against the growth rate of the Cost of Goods Sold (COGS). If COGS is growing faster than revenue, the business model is under pressure, that’s often a sign of intense competition or supply chain bottlenecks. Management may have downplayed in their written commentary.
On the balance sheet, assess solvency and liquidity trends, and on the cash flow statement, determine whether growth is acquisition-driven or organic. A company can report positive net profit but negative cash flow, which could be a red flag. Examine accounting policy changes and unusual adjustments in the notes. Even small changes in how a company recognizes revenue or values assets can significantly impact reported financial results and make year-over-year comparisons misleading.
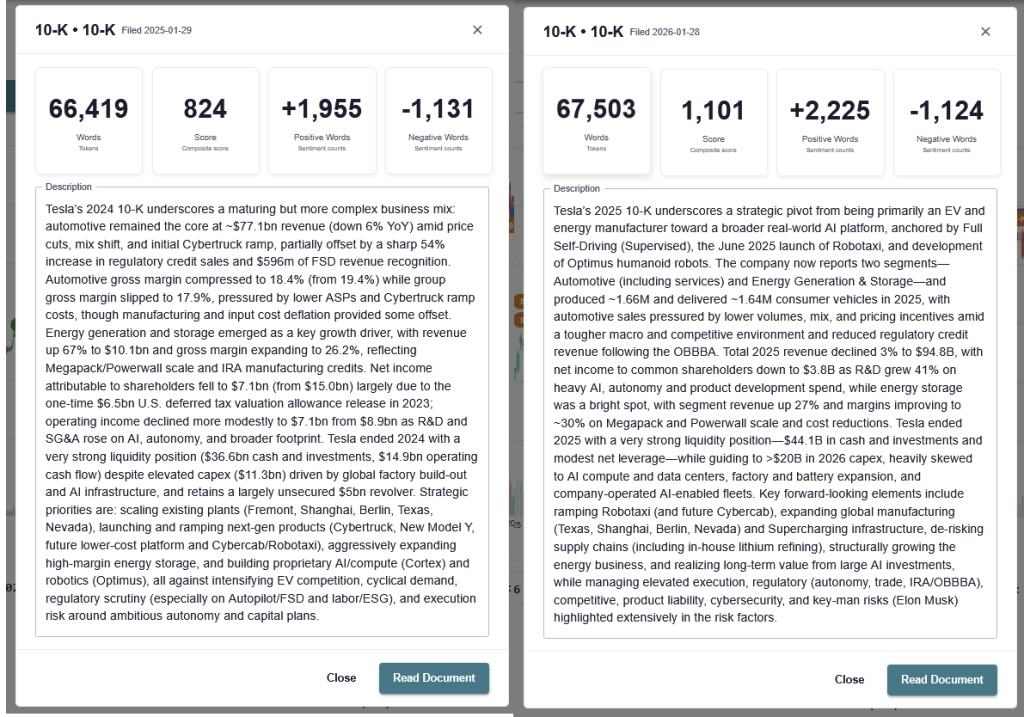
The summary should document key metrics such as revenue, gross margin, operating income, free cash flow, and return on equity. It can be as simple as a table across at least three to five years to identify trends. For example, comparing the Tesla summaries between 2024 and 2025 indicate a major pivot has occurred from vehicle manufacturing to humanoid robots and robotaxis. Furthermore, the Cybertruck that was introduced as a new model in 2024 is no longer a headline in Tesla’s growth outlook. Positive word count has increased as well, indicating a more optimistic narrative than before.
Watch the below video to see how quickly and easily you can navigate through filings, to understand the root cause of price action on a stock based on past filings / statements
Reviewing Risk Disclosures
Risk disclosures, found in Item 1A, are among the most consequential and under-read sections of a 10-K. Risk Factors includes information about significant risks that the company faces, generally listed in order of importance. Value investors should read these disclosures not merely to understand what could go wrong, but to evaluate how candidly and specifically management is communicating. The risks should be specific to the company’s industry, operations, and financial situation. Generic risks are not sufficient, and the focus should be on risks that could significantly impact the company’s performance or financial well-being. One of the most practical techniques is to compare the current year’s risk factors against the prior year’s. If a risk factor that wasn’t mentioned in the previous year jumps higher on the list, this could be a warning sign. The goal is determining whether the risks disclosed are already priced into the stock or represent a hidden vulnerability that the market has overlooked.
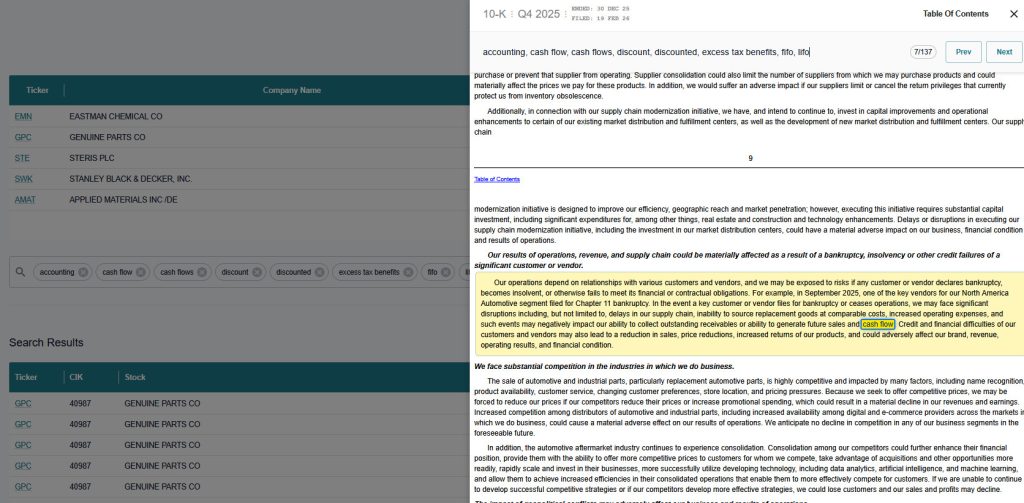
Search10K contains standard risk themes within its Theme Browser: ACCOUNTING, ACQUISITION, GOVERNANCE, ENVIRONMENTAL, LEGAL/REGULATORY, and QUALITY OF EARNINGS. It scores companies based on the positive or negative sentiment associated with these keywords. For example, it ranked Genuine Parts Company under Quality of Earnings, Accounting and Acquisition themes. Investors can save a lot of time reviewing these long documents, where keywords are treated as a bucket rather than one at a time. Investors who master the subtext can gain valuable insights not immediately apparent to the less discerning reader. This gauges not just the risks themselves, but how the company plans to navigate them. Areas to focus on include customer concentration, regulatory exposure, pending litigation, competitive threats, and cybersecurity disclosures.
Preparing the Summary for an Investment Decision
Once the reading and analysis are complete, the summary itself should be structured to support a clear investment decision. A well-prepared 10-K summary typically includes six components:
- a business overview — what the company does, its competitive moat, and key customers
- a financial snapshot, comprised of a multi-year table of critical metrics
- an MD&A synthesis which is management’s explanation of performance and the investor’s independent assessment of its credibility
- a risk register, where the most material risks and whether they are adequately mitigated
- a valuation note, where intrinsic value estimate versus current market price; and
- a decision recommendation with supporting rationale.
Sophisticated investors often maintain checklists of key items to review in each section of the 10-K. Investors track changes year-over-year to spot trends before they become obvious in the financial results. To build a complete, defensible valuation model, you must focus equally on the narrative sections and the fundamentals. For example, the narrative of Item 1A (Risk Factors) and hard numbers like Item 8 (Financial Statements). To cross-reference management’s discussion with the audited balance sheet is the only way to get a clear picture. The summary should be concise and written in plain language that forces you to articulate your investment thesis without ambiguity.
Conclusion
Creating a 10-K summary is not merely a reading exercise — it is a discipline that sharpens analytical thinking and builds genuine conviction in an investment decision. With the right approach, the 10-K can become your most valuable tool for understanding a business. The process of moving through the business description, MD&A, financial statements, and risk disclosures in a deliberate sequence ensures that both qualitative and quantitative dimensions of the company are assessed together. Look for positive and negative material changes. For example, declining gross margins, weakening cash flow, or increases in long-term debt that may need to be examined further. For the value investor, the 10-K summary ultimately serves as the primary input into a valuation model. This document forms the baseline investment rationale that can be revisited as new filings emerge. The 10-K is more reliable for analysis because it is a legal document certified by executives. Summarizing it is the most responsible way to manage investment risk and build long-term portfolio quality. Mastering this process takes practice, but investors who do so gain a meaningful informational edge over those who rely on analyst reports or news summaries alone.