
Introduction: Why Competitive Structure Matters for Investors
Imagine two companies with nearly identical financial profiles: their margins are similar, so too is their revenue growth, and their capital structure is exactly the same. They might be considered twins in a financial sense, yet much as twins in the natural world they have developed differently. One is able to compound value at a healthy 15% annually while the other struggles to earn its cost of capital.
There may be many causes for such disparity. But a likely reason is the difference in industry structure. One operates in a field where competitive forces leave room for pricing power, customer stickiness, and sustainable cost advantages; the other lives in a gladiators’ arena where rivals, suppliers, and customers steadily squeeze returns.
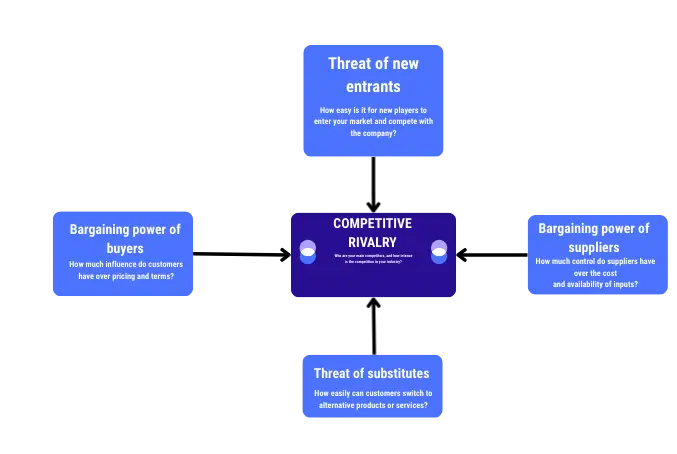
Michael Porter’s pièce de résistance, the Five Forces Model, helps explain why. Porter argues that competitive advantage stems not from short-term operational tweaks but from the underlying structure of the industry and the distinct activities a firm performs. These activities, such as how a company creates, produces, sells, and delivers value are “the basic units of competitive advantage”.[i] Understanding how power flows through an industry, and how firms can position themselves within it, is indispensable to long-term investing.
This is where Porter’s Five Forces framework becomes an essential analytical tool. It provides a bird’s-eye view of the social and economic landscape in which a company operates, by examining:
- The threat of new entrants
- The bargaining power of suppliers
- The bargaining power of buyers
- The threat of substitutes
- The intensity of competitive rivalry
For investors, this framework directly strengthens three pillars of long-term equity analysis:
Better moat analysis
Porter emphasizes that sustainable advantage comes from performing a unique set of activities that make imitation difficult for rivals. The Five Forces framework helps investors judge the durability and wideness of those moats, i.e. whether a company can truly “establish a difference that it can preserve.”[ii]
More accurate valuation assumptions
Revenue growth, pricing power, and margin sustainability all rest upon industry power dynamics. For instance, if suppliers capture most of the value, margins will compress regardless of management excellence. If rivalry is cutthroat, returns will deteriorate. Understanding the forces helps explain why some firms are able to reinvest at high rates of return, while others stagnate.
Early detection of structural change
Industry forces shift: new technologies, new customer groups, or new channels can open up entirely new positions in a market. Investors who track these shifts can foresee margin pressure developing, emerging entrants, or lessening switching costs long before they show up in reported numbers.
Investment research firms such as Morningstar integrate the Five Forces into competitive-advantage assessments, recognizing that industry structure is often more predictive of long-term returns than short-term financial metrics. Institutional investors routinely embed the logic of Porter’s framework into their methodologies.
What to Expect in this Article
This article discusses Porter’s Five Forces framework explaining what each force reveals about competitive dynamics and offering an introduction to using the framework for investment analysis. The goal is simple: to improve the ability to assess an investment by pairing financial statement analysis with an understanding of the competitive environment in which the firm operates.
I. Threat of New Entrants: Assessing the Fragility of Competitive Advantage
A perennial feature of the business environment is the appearance of a “new kid in town” who threatens to disrupt the industry. In the 1990s, the video rental industry was dominated by brick-and-mortar establishments, most notably Blockbuster. Then along came Netflix (founded in 1997), which presently (November 2025) is the world’s largest video streaming service. Blockbuster filed for bankruptcy in 2010. Soon after, the entire video rental store industry vanished, as streaming became the dominant model for home entertainment.
In a similar fashion, Uber, launched in 2010, has disrupted the taxi business, which, traditionally, has operated as a multitude of separate, local markets. Once again, technological developments allowed a new business model to be implemented. It is now possible for someone in New York to arrange a cab ride for another in California in a matter of minutes.
Newer entrants to an industry generally arrive armed with new technologies. But technology is not all, says Porter. Technology can improve operational effectiveness, but operational effectiveness is no substitute for strategy. Indeed, the advanced technologies employed by Netflix were available to Blockbuster. And initially, Netflix was mailing its videos. Its streaming service did not commence until 2007, a decade after the company’s debut. It seems the game changer was not technology; it was something else – strategy.
A 2022 study Two Decades and More: Evolution of Netflix’s Business Models and Outlook of Future analyzed the strategy that propelled Netflix to dominance. The study found that while Netflix quickly adopted a subscription model that emphasized convenience and predictable pricing, Blockbuster retained a transactional rental model that was heavily reliant on late fees. This was a revenue source that created intense customer dissatisfaction.
Netflix also, unlike, Blockbuster embraced technology as a strategic asset. As well as the streaming infrastructure, the company took advantage of cloud scalability and data analytics to develop personalization algorithms and similar features. The tactics employed by Netflix enabled it to become co-creator of a new type of business and to dominate that business.
The Porter Five Forces framework provides a taxonomy of such tactics. It offers a reminder that qualitative and quantitative data are complementary.
In general, a company can resist threats by new market actors by enjoying the protection of natural or strategic barriers. Its business may also be shielded by regulatory barriers and market barriers.
The automobile industry offers further insight into how new entrants can upend a marketplace. Vehicles powered by electricity have been around since the 19th century, but electric vehicles (EVs) never quite caught on. That changed after Toyota launched its Prius model in 1997. Then, EV development accelerated after Tesla Motors entered the market. Thereafter, competition intensified as other industry players introduced their EV models, notably the Chevy Volt and the Nissan LEAF.
From those modest beginnings, EV adoption has grown rapidly. According to the International Energy Agency (IEA), in 2024, “more than 20% of new cars sold worldwide were electric”. In the U.S., a similar market expansion is underway. In 2024, the U.S. EV market share crossed the 10% mark.
Perhaps the three main factors driving EV adoption are affordability, government incentives and government policies. An IEA Report concludes that “falling battery pack prices and intensifying competition underpin progress in electric car affordability”. The Report also states that “electric cars often have a lower total cost of ownership than internal combustion engine (ICE) cars over the vehicle lifetime, due to reduced fuel and maintenance expenses.”
Government support has been forthcoming in two ways: in tax incentives and in legislation. For vehicles acquired before September 2025 a tax credit of up to $7,500 under Internal Revenue Code Section 30 was made available. Additionally, major amendments to the Clean Air Act (CAA) in 1990 strengthened auto-emissions rules. Notably also, in Massachusetts v. EPA (2007), the Supreme Court ruled that CO2 was a pollutant under the CAA.
Overall, the main driver of EV adoption is the increasing awareness, both by consumers and governments, of the adverse effects of fossil fuels on the environment. This trend bodes well for EV companies and is the subject of much investment research.
Thus, EV companies have lowered the barriers to entry that protected markets dominated by ICE vehicles and manufacturers by developing less costly infrastructure for both manufacturing and recharging / refueling. In turn, the lower infrastructural costs have been made possible because EV technology is less complex than ICE vehicles, e.g. simpler drivetrains, etc. As a result, barriers to entry, such as multi-billion-dollar production facilities, that protected ICE manufacturers, are no defense to new entrants.
Main Barriers to Entry
1. Structural (Natural) Barriers
These arise from the inherent characteristics of the industry.
a. Economies of Scale
Large incumbent firms often produce at lower average costs because of scale.
New entrants, starting small, face higher costs and cannot match the incumbent’s prices.
b. High Capital Requirements
Industries like airlines, steel, telecoms, and pharmaceuticals require enormous initial investment.
A new firm may simply not be able to raise the necessary capital.
c. Network Effects
Products become more valuable as more people use them (e.g., social media, operating systems, payment networks).
A new entrant struggles to attract users without an existing network.
d. Natural Monopoly
Some industries have such high fixed costs and such low marginal costs that one large provider is most efficient (e.g., utilities).
Regulation often restricts entry for safety and efficiency reasons.
2. Strategic (Deliberate) Barriers
These are created by incumbent firms to protect their market position.
a. Predatory Pricing
Incumbents temporarily lower prices below cost to drive out new competitors.
b. Limit Pricing
Incumbents set prices just low enough to make entry unprofitable.
c. Excess Capacity
Existing firms may build more capacity than needed to signal they can flood the market if entry occurs.
d. Advertising and Brand Loyalty
Heavy advertising can create strong consumer loyalty, making it hard for newcomers to gain recognition.
e. Control of Essential Inputs or Distribution Channels
Incumbents may have long-term contracts or exclusive access to key raw materials, suppliers, or retail channels.
3. Legal and Regulatory Barriers
Governments may intentionally or unintentionally restrict entry.
a. Licensing and Permits
Industries such as medicine, finance, law, broadcasting, and transportation require formal licensing.
b. Patents and Copyright
Legal protection of intellectual property prevents others from copying innovations.
c. Standards and Compliance Costs
Regulatory compliance (environmental, safety, data protection) imposes costs that small entrants may struggle to absorb.
d. Tariffs and Trade Restrictions
For international firms, tariffs or quotas can make entry into a new country’s market prohibitively expensive.
4. Barriers from Market Conditions
These are softer but still impactful.
a. Customer Switching Costs
If customers must pay or endure inconvenience to switch providers (e.g., changing enterprise software), entry is harder.
b. Access to Technology
Proprietary or industry-specific technology may be unavailable to new entrants.
c. Access to Skilled Labour
New firms may struggle to hire specialists in sectors like biotech or AI.
Having an effective barrier or barriers is having protection similar to that afforded to medieval castles. That a business should have a competitive advantage “moat” was popularized by Warren Buffett, but the concept has earlier origins in the writings of J.S. Bain.
In Barriers to New Competition, 1956, Bain “suggests that the roster of factors determining the competitiveness of a given industry is incomplete unless one considers entrepreneurial behavior in the light of possible entrants into the industry.”
The idea of a moat in marketplaces has been expressed in a variety of ways. The renowned French portfolio manager Jean‑Marie Eveillard says “The qualitative side [of analysis], is of course, judgmental and has a lot to do with trying to figure out the three, four or five major characteristics of a business. That means you must identify what makes a business special, those unique characteristics that are difficult for other businesses to duplicate.
II. Bargaining Power of Suppliers: How Inputs Shape Profit Stability

The story of Rumpelstiltskin is a master class in illustrating the power suppliers may wield. Because of an unfortunate boast by her father, a miller’s daughter must spin straw into gold for the king or her father would be executed.
Only Rumpelstiltskin can supply the ability to perform this humanly impossible task. He names escalating prices, first a necklace, then a ring, and eventually her future child, and she must agree to his terms because she has no alternative supplier. This is supplier’s bargaining power at its most extreme. Rumpelstiltskin can name any price, since he provides a unique service, for which there are no substitutes.
This Grimm brothers’ tale illustrates clearly that supplier differentiation and uniqueness create leverage. When buyers have no alternatives, suppliers can set the price, and bargaining power then shifts entirely to the supplier.
The introduction of tariffs on imported vehicles will strengthen the bargaining power of U.S. automakers by reducing competitive pressure from foreign brands. The base customs duty on passenger cars has historically been 2.5%. On April 3, 2025, the U.S. government imposed an additional ad-valorem tariff of 25% on imported passenger vehicles, light trucks, and certain key auto parts under national-security provisions (Section 232 of the Trade Expansion Act). In practice, that means many imported passenger cars face a combined tariff rate of roughly 27.5% (2.5% base + 25% additional).
With imports becoming more expensive, domestic producers gain a protected market position that allows them greater latitude in pricing, output decisions, and negotiations with suppliers and distributors. Tariffs narrow consumers’ options and weaken competitive rivalry, enabling U.S. automakers to capture a larger share of demand and negotiate from a position of enhanced strength, not only with their customers but across their value chains. This also applies to the electric vehicle market, whereby foreign-owned manufacturers such as BYD are now at a disadvantage relative to US-based manufacturers such as Tesla, and GM.
Here are five conditions that signal suppliers may have undue influence. Naturally, this list is not exhaustive.
1. Supplier concentration
- The supplier group is more concentrated than the industry it sells to.
- Example: In the 1990s, Microsoft earned producer surplus because its operating system was licensed to many fragmented PC assemblers.
2. Low dependence on the buyer industry
- Suppliers do not depend heavily on the industry for their revenue.
- Example, Microsoft derives revenue from hardware sales, online services, cloud computing, gaming, etc., not solely from software.
- When an industry represents only a small portion of suppliers’ business, suppliers are more willing to exert pressure.
- If the industry accounts for a large share of supplier revenue, suppliers tend to behave more cooperatively.
3. High switching costs for industry participants
- Buyers in the industry face high switching costs when changing suppliers.
- High switching costs prevent firms from playing suppliers against one another.
- Pharmaceutical companies selling patented drugs are Porter’s key illustration.
4. No substitutes for the supplier’s product
- When no good alternative exists, suppliers gain leverage.
- Example: airline pilots’ unions: no substitute for trained pilots.
- Airlines are dependent on large, complex aircraft that can be produced only by two firms: Boeing and Airbus.
- Electric vehicle manufacturers depend on batteries as the critical technology to deliver vehicle range. This creates a squeeze on demand for rare earth elements such as lithium and cobalt that make up the electrolytes within the battery. Those minerals can only be sourced from certain places.
5. Credible threat of forward integration
- Suppliers can credibly threaten to enter the buyer’s industry.
- If suppliers could profit more by integrating forward, buyers must accept higher prices or less favorable terms.
- Example: Intel initially focused on producing microprocessors, but in the early 2000s began making PCs and minicomputers, taking market share from OEMs, such as Dell, Lenovo and HP.
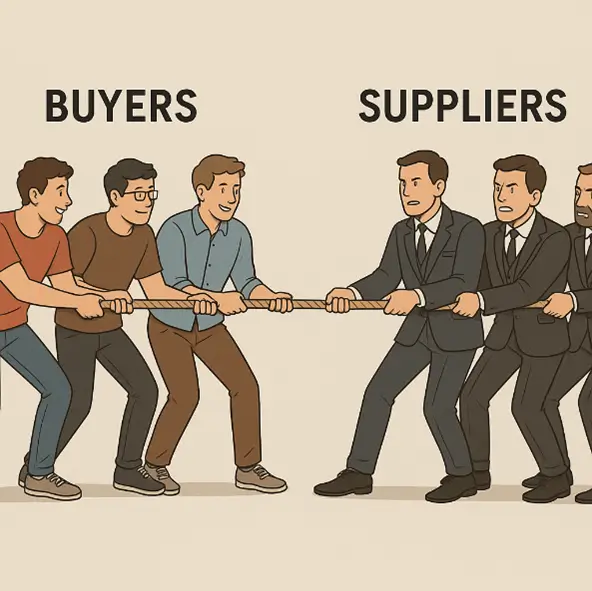
III. Bargaining Power of Buyers: Understanding Margin Pressure from the Demand Side
To some degree, the relationship between buyers and sellers is akin to a tug-of-war. Over time, the balance changes in favor of one side or the other. Porter frames the buyer–supplier relationship as a bargaining relationship over a fixed pool of value at the industry level.
Supplier power affects industry profitability because powerful suppliers tend to capture more of the value created than buyers.[iii] At the industry level, he views the relationship in distributive (zero-sum) terms.
“Porter writes that suppliers are powerful when they are concentrated, differentiated, or have switching-cost advantages. Suppliers can then extract rents from buyers, reducing buyers’ profits.
But the relationship is not necessarily a zero-sum game, although it might be. Porter recognized that. He explicitly notes that first movers, innovators, cluster advantages, and value-chain redesign create additional value; so within industries, firms can escape pure zero-sum bargaining.
These ideas are supported by the work of Dyer and Singh who conclude the buyer-supplier relationship as decisively positive-sum. Trust, knowledge sharing, and co-specialisation create inter-firm competitive advantage that is not available to either party working alone.[iv] They “offer a view that suggests that a firm’s critical resources may span firm boundaries and may be embedded in interfirm resources and routines.”
Here is a synopsis of the possible differences:
Competition & Cooperation in the Buyer-Supplier Relationship
Zero-sum when:
- Product is a commodity
- Relationship is arms-length
- Switching costs are low
- No trust or collaboration
- No shared incentives
Positive-sum when:
- Buyers and suppliers co-innovate
- Information is shared
- Contracts are long-term and relational
- There is asset specificity
- Both sides invest in the relationship
Two classic cases of buyers’ power can be taken from the retail and automobile sectors. In retail, Walmart is the quintessential buyer of power. The company is one of the largest single buyers of consumer goods in the world. Since its purchases represent a massive share of many suppliers’ total sales, it can negotiate very low prices, strict delivery schedules, logistics requirements, and even packaging specifications.
In the car industry, OEMs like Ford, Toyota, and GM, hold most of the power. OEMs can pressure suppliers to absorb cost increases, maintain stringent quality control, or adopt just-in-time systems. Since suppliers are fragmented and automakers are few and large, the buyer concentration effect dominates.
In the EV market, government incentives and policies have had the effect of increasing buyers’ bargaining power: by lowering the effective price consumers pay and by expanding the pool of potential purchasers.
These policies may have been designed to help the industry reach scale, but they have also shifted the balance of power in buyers’ favor. When a household’s vehicle purchase is subsidized by up to 25%, consumers become more price-sensitive and more willing to compare models across brands, knowing that part of the cost is underwritten by the state. This heightened ability to walk away from a deal strengthens buyer leverage, compelling EV manufacturers to compete more aggressively on price, features, and financing options.
IV. Threat of Substitutes: Hidden Forces That Undermine Growth
In The Five Competitive Forces that Shape Strategy, Porter discusses the surreptitious nature of substitutes. A substitute performs the same or similar functions as an existing product but by a different means. He gives the following examples: videoconferencing vs. travel; plastic vs. aluminum; email vs. express mail; DIY vs. hiring a service; used goods vs. new goods.
Substitutes look quite different from the product, which is why they are often overlooked, and why they pose a threat. “To someone searching for a Father’s Day gift, neckties and power tools may be substitutes.”
Substitutes threaten an industry in two ways. First, they place a ceiling on prices and profits. Second, they can limit growth. For example, in India and most of Asia, wired landline demand plateaued because consumers opted for mobile phones as their first line.
Substitutes limit industry profit by exerting downward pressure on prices. In the chart above, substitutes flatten the demand curve.
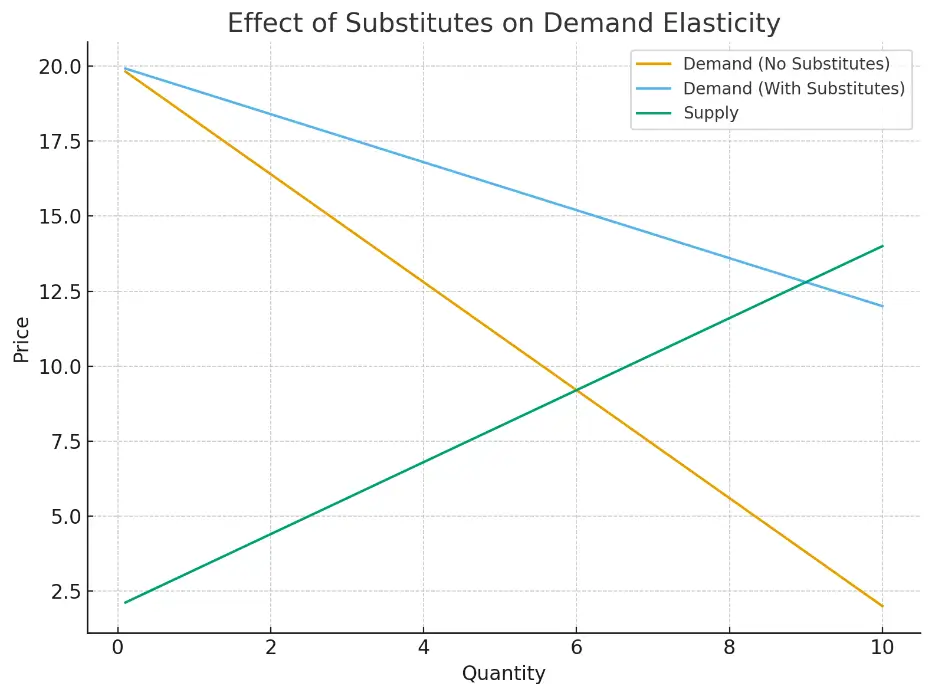
The (orange) curve with the steep slope gives a picture of strong demand: quantity demanded falls slowly as price rises. This means that consumers are relatively insensitive to price. The demand curve exhibits low elasticity.
Weaker demand is indicated by the demand curve with the flatter slope. The curve becomes more elastic where there are substitutes. This higher elasticity means that buyers are more price-sensitive, so that any rise in price causes quantity demanded to fall rapidly.
| Note that, in economic terms, “demand” and “quantity demanded” are two different concepts. Demand refers to the overall intensity of buyers’ desire for a good, as determined by fundamental forces, such as income, wealth, preferences, etc. Changes in these forces cause shifts in the demand curve. At a particular level of demand, the demand curve shows the quantity demanded at different prices. Elasticity is the percentage change in quantity demanded divided by the percentage change in price. |
The introduction of digital photography provides a clear illustration of how substitutes can disrupt an industry. Digital cameras were not a direct competitor in the same category as film; they were a substitute technology that allowed photos to be taken without buying film, developing rolls, or printing pictures. The convenience this offered meant a massive decline in the demand for film, darkroom chemicals, and photo-printing services. Yet Kodak, the dominant incumbent in analog cameras and film processing, failed to pivot quickly enough to the digital era and filed for Chapter 11 bankruptcy in 2012.
The Blockbuster-Netflix scenario, discussed above, is another saga of a substitute rising to power. So too is the resurgence of EVs, since electric vehicles are simply substitutes for internal combustion engine automobiles. In fact, there are already disincentives in place for ICE vehicles, as many state-imposed consumer-based taxes are applied on gas but none on electricity.
V. Industry Rivalry: The Force That Shapes Returns Year After Year
Rivalry refers to the intensity and basis of competition among existing firms in an industry. It takes many forms: price cuts, advertising battles, new product introductions, customer service improvements, etc.

Porter packs a number of crucial factors and forces into the omnibus of rivalry. These include the number of competitors, the cost structure, the extent of differentiation, the growth rate of demand, and the existence of exit barriers. Porter suggests these are the factors and forces that determine how returns are worn down by competition.
These determinants also affect valuation stability and long-term Return on Invested Capital (ROIC). Furthermore, profit potential depends on both the intensity and basis of competition, whether on price or not on price. Naturally, an intense rivalry will limit industry profitability.
The term rivalry carries a combative connotation. It suggests the presence of animosity, contempt, or one-upmanship. But Porter’s insight is more nuanced; rivalry can cut both ways.
Rivalry can be destructive when competitors fight in ways that erode industry profitability.
This occurs when firms compete primarily on:
- Price discounting
- Escalating advertising battles
- Feature over-engineering that raises costs
- Short-term promotions that reset customer expectations downward
- Capacity races that depress margins
These forms of rivalry lower the average (ROIC) for everyone. For example:Airlines competing through aggressive fare cuts have caused industry profits to collapse.
But rivalry can also be constructive. Rivalry cuts the other way when competition pushes firms to innovate, differentiate, and improve value without destroying profit margins.
Constructive rivalry tends to:
- Raise quality
- Expand total demand
- Increase customer willingness to pay
- Improve operational efficiency
- Set higher standards for the industry
- Reinforce differentiation instead of eroding it
Example:Smartphone manufacturers unique approach on design, device networked ecosystems, and integrated camera / sensor technology result in buyers’ higher willingness to pay, and strong margins (Apple, Samsung).
In these cases, rivalry strengthens industry health by pushing firms to create better value rather than simply compete away profits.
Thus, rivalry is not inherently good or bad; its nature depends on how companies choose to compete. Malicious competitors would view rivalry as a zero-sum contest. That approach leads to margin compression. Firms fight for share by lowering price and raising cost, making everyone worse off. It can degenerate into initiating harmful practices against the rival.
Healthy rivalry, on the other hand, creates value, as competitors improve their own performance. Then firms compete on differentiated value, making each other better. Rivalry that expands value, innovation, and differentiation will increase, not decrease, industry profitability.
Perhaps the classic case of rivalry is the competition between Coca-Cola and Pepsi. The rivalry is intense primarily because of the low switching costs. Consumers can, and often do, switch beverages based on taste, promotions, or price. Porter, in fact, uses the example of the Coca-Cola/ Pepsi competition to demonstrate how rivalry erodes profitability when firms compete mainly on marketing spend and product proliferation, as in the “Cola Wars”.
The rivalry between Airbus and Boeing is another duopolistic clash, with the battle taking place on many fronts. Most importantly, for aircraft manufacturers, getting an order is a winner-take-all situation. There is no reward for coming second. Aircraft development requires billions in innovation investment and the only way to recover those costs is to keep winning contracts.
At present, the most evident panorama for rivalry is the competition between the various content streaming services. Competition has intensified as new players continue to enter the market. As in the Cola Wars scenario, the switching costs are low for consumers. A few clicks on a remote is all it takes to get from one streaming service to another.
The rivalry in EVs is also playing out before us today: where historic ICE manufacturers are pivoting aggressively to take away market share from Tesla, which was first to market in North America. Tesla continues to lead the pack with about 50% of the market. It’s unclear how long this first-mover advantage is likely to last. Elon Musk’s involvement in politics has marred the company’s public image indelibly. In 2025, the company experienced declines in sales in all markets. Notably, its European sales fell by 30%, while overall EV sales in the region rose by 26%.
Still, Tesla’s lead over its nearest rival General Motors (which includes the Chevrolet, Cadillac, and GMC EV models) is substantia with sales volume is three times as much. Ford is third with its Mustang Mach-E, F-150 Lightning, and E-transit EV entrants. Hyundai / Kia is showing strong growth with the Ioniq 5/6 and EV6 models. Rivian, backed by Amazon, has a small but growing market share with its R1T and R1S models. At this point, there is ample opportunity for each to compete by innovating. But innovating is tough. It’s much easier to engage in traditional marketing tactics, such as ads and discounts.
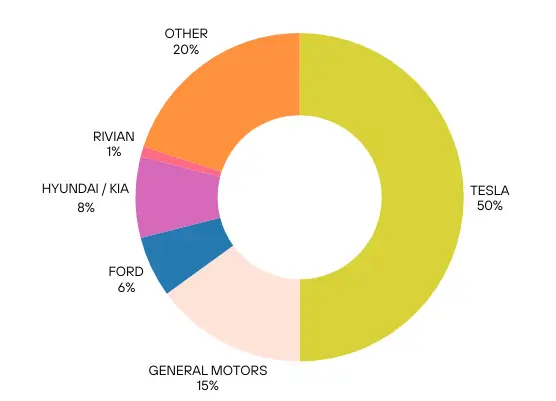
Source: Visual Capitalist, Tesla Still Dominates with Nearly 50% of U.S. EV Sales
How the Five Forces Work Together in Investment Analysis
One must view the five forces Porter examined as a dynamic framework: changes in one affect the others. Industry structure sets long-run profitability because it determines how the economic value created by an industry is divided among industry participants, suppliers, buyers, substitutes, and potential entrants. One force may dominate in a particular market; then it becomes the most important for strategy, but all forces mold the competitive environment and must be assessed as one.
Porter provides examples of how the forces influence each other. Lowering entry barriers can increase rivalry. New substitutes can reduce buyer power but worsen rivalry. Supplier consolidation can shift rivalry from quality to price.
Most importantly, it is the interplay of all five forces that delineates the true boundaries of competition, not product categories or NAICS codes. The relevant industry is defined by the collective effect of the forces.
How Investors Should Use Porter’s Five Forces
Porter’s Five Forces remains one of the most powerful frameworks for analyzing the external market environment. For investors, its value lies in revealing how industry structure shapes long-term profitability: why some industries sustain high returns while others suffer margins that barely cover the cost of capital.

However, external analysis alone is insufficient. Investors must pair a Five Forces assessment with internal analysis to understand not only whether an industry is attractive, but whether a specific firm possesses the capabilities to win within it.
The renown Indian parable of the blind men and elephant reminds us that analyzing the impact of just one of Porter’s forces on a company gives a distorted view of the company. Only by seeing all five forces together, and how they interact, can we understand the true structure and profitability of an industry.
A practical way to integrate the model into investment research is to link each force to a metric or valuation methodology:
1. The Threat of New Entrants May Affect ROIC Trend & Reinvestment Rate
New entrants erode excess returns (economic rent). Investors should track industry and company-level ROIC relative to cost of capital and observe whether reinvestment continues to earn attractive incremental returns. Stable or rising ROIC in the presence of potential entrants signals durable barriers; declining ROIC suggests eroding moats.
2. Supplier Power May Affect Gross Margin Stability
Supplier concentration, switching costs, or unique inputs could impact gross margins. Stable or expanding gross margins indicate weak supplier power; margin compression suggests the opposite: suppliers are capturing value. Investors can stress-test margins in varying income statement scenarios.
3. Buyer Power Drives Prices Down
High buyer power results in discounting, churn, and weak pricing power. Investors should examine net revenue retention, pricing/packaging contribution to growth, and customer concentration ratios. The customer concentration ratio is a measure of the share of total revenue that is derived from its largest customer(s). It reveals how dependent the firm is on those customers. The corollary is that such customers have bargaining power directly proportional to the ratio. A ratio of 65% signals strong buyer power; a ratio of 20% indicates buyers lack bargaining power.
These metrics help clarify whether customers can force concessions or whether the firm can raise prices without losing volume.
4. Assess the Threat of Substitutes with Elasticity & Total Addressable Market Analysis
Substitutes place a ceiling on prices and limit growth. Investors should assess demand elasticity, compare willingness-to-pay across alternatives, and model Total Addressable Market (TAM) fragmentation. Discounted Cash Flow (DCF) models can incorporate substitute risk by reducing long-run pricing power or by shortening fade periods in valuation.
5. Industry Rivalry May Cause Margin Volatility; Measure with Competition Indices
The tenor of rivalry dictates whether competition is constructive or destructive. Investors should evaluate EBIT margin volatility, Herfindahl-Hirschman Index (HHI) trends, and the basis of competition (price vs differentiation). Highly volatile margins typically reflect destructive rivalry, which depresses long-term ROIC and valuation multiples.
Volatility in EBIT margin may be a sign of intense price competition. If firms are competing on price, any number can play. The Herfindahl-Hirschman Index (HHI) measures market concentration. Here’s an example of how it works for a three-firm market.
Suppose the market shares are A: 50%, B: 30%, C: 20%.
Then HHI = 502 + 302 + 202 = 3800
The Department of Justice considers “ markets in which the HHI is between 1,000 and 1,800 points to be moderately concentrated, and consider markets in which the HHI is in excess of 1,800 points to be highly concentrated.” With the US EV market share estimates above, the HHI is computed to be 2826, which is defined to be “Highly Concentrated”.
Integrating the Framework
Used properly, Porter’s Five Forces does not replace financial analysis; they anchors it. It tells investors why profit margins, ROIC, and cash flows look the way they do, and whether those elements are structurally reinforced or at risk. Combined with internal analysis of capabilities, the framework helps investors determine whether a company is likely to be a creator of value or an underperformer within its marketplace.
[i] Porter, M. E. (1996). What is strategy? Harvard Business Review. https://hbr.org/1996/11/what-is-strategy
[ii] Ibid
[iii] Michael E. Porter, Competitive Strategy (1980), Chapter 2 — “The Structural Analysis of Industries,” Section: “The Power of Suppliers, p.27;
How Competitive Forces Shape Strategy,” Harvard Business Review, March–April 1979.
[iv] The Relational View: Cooperative Strategy and Sources of Interorganizational Competitive Advantage (Academy of Management Review, 1998, Vol. 23, No. 4, pp. 660–679). journals.aom.org+2